
How Walkable is Algonquin, IL?
Scoring 26 out of 100, Algonquin near Chicago, IL sits at the bottom end of the "Car-Dependent" Walk Score range. The village straddles the Fox River on the western edge of the metro, where postwar suburban development dominates.
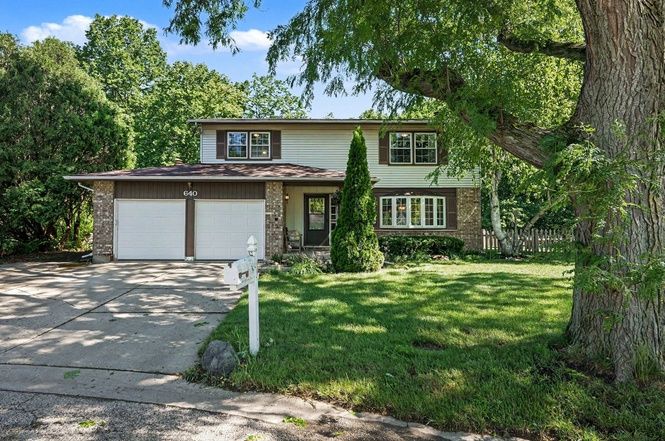
Walkability in the Chicago area
Algonquin's 26 falls far below the metro average of 77. Neighboring Crystal Lake (30) scores slightly higher, while Grayslake (28) to the northeast is similar. The gap to even mid-tier walkable suburbs like Arlington Heights (48) is roughly 23 points.
No Metra station serves Algonquin directly, though the UP-Northwest line in nearby Crystal Lake provides regional rail access. Randall Road and Route 31 are the primary commercial corridors, both designed for auto traffic with big-box retail centers. The Fox River Trail provides recreational cycling but not practical transportation.
What a Walk Score of 26 means
Algonquin's Walk Score of 26 means almost all errands require a car. Residential neighborhoods are physically separated from commercial areas by wide roads and parking lots. No public transit serves the village for local trips. The bike score of 49 (Minimal Bike Infrastructure) reflects trail access but no commuter cycling routes.
Why do buyers choose Algonquin?
Algonquin provides a larger home for the money in the far northwest suburbs. The median sale price of $414,792 is slightly above Crystal Lake ($369,815) but offers newer housing stock from the late 1990s and 2000s. About 47% of homes sell above asking, with 47 days on market. Prices are down 3% year over year, making it one of the few areas in this batch where buyers have some price leverage.
The tradeoff is complete car dependence and distance from Chicago. Buyers who choose Algonquin over Crystal Lake are typically paying a slight premium for newer construction and larger lots. Those who prioritize walkability need to move significantly east or south—to Arlington Heights or Schaumburg—at similar or higher prices but with much better pedestrian access. Algonquin buyers have made their peace with driving everywhere in exchange for space and relative value.
| Location | Walk Score | Bike Score | Transit Score | Median sale price | Days on market |
|---|---|---|---|---|---|
| Algonquin | 26 | 49 | -- | $414,792 | 47 days |
| Grayslake | 28 | 44 | 21 | $402,299 | 43 days |
| New Lenox | 24 | 41 | -- | $457,271 | 42 days |
| Mokena | 23 | 37 | -- | $518,041 | 43 days |
| Batavia | 29 | 52 | -- | $509,745 | 40 days |
| Bartlett | 22 | 49 | -- | $442,279 | 42 days |
Limited to neighborhoods with at least 10 home sales in the period.
All data comes from Redfin and represents a three-month rolling average ending July 2026. This article has been generated, in whole or in part, using generative artificial intelligence (AI) technology, with input from Redfin head of economics research Chen Zhao. While efforts have been made to ensure the accuracy and reliability of this information, you should independently verify all data, facts, and citations contained in this article before relying on it for any purpose. This information is not a substitute for advice from a real estate agent, financial advisor, or other licensed professional. Check the Redfin Data Center for additional in-depth housing market data.
Categories
Recent Posts





Redfin Principal Agent License ID: IL #475159373
+1(773) 206-5927 | jenny.habetler@redfin.com