
Are Home Prices Rising or Falling in Algonquin, IL?
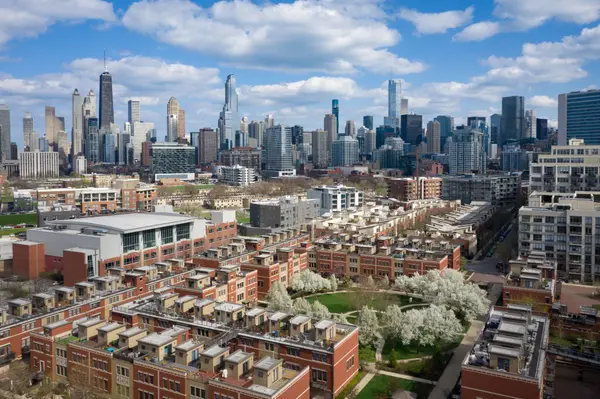
Algonquin, a city near Chicago, IL, is one of the few Chicago-area suburbs where home prices have moved lower. The median sale price fell 3.3% year over year to $414,716, a shift that could open the door for buyers who were priced out during the recent run-up. Here's a look at what's behind the numbers and what it means for you.

The National Picture
In the three months ending August 2026, the U.S. median home sale price reached roughly $399,000, up about 2% from a year earlier. American households earning about $88,000 are now spending around 34.4% of income on housing, a 1.6-point improvement from the prior year. Price reductions affect about 20% of listings nationally, and there's approximately four months of supply across the country.
Home Prices in the Chicago Area
Chicago-metro households earn around $99,000 and put approximately 35.1% of that toward housing, barely changed from a year ago. Algonquin's median of $414,716 falls well within reach for a dual-income household earning the metro median, and the recent price decline means a buyer today could pay roughly $14,000 less than the same home would have cost last year.
Prices Are Cooling as Inventory Builds
The 3.3% decline in Algonquin is more pronounced in some neighborhoods than others. West Algonquin dropped 12.4% to $424,785, and High Hill Farms fell a steep 21.4% to $399,807. On the other hand, East Algonquin gained 4.1% to $379,817, and Far West Algonquin rose 2.7% to $554,732. Citywide, about 45.9% of homes still sell above list price, but 24.6% of active listings carry a price reduction, above the national rate and one of the higher figures among Chicago suburbs.
Why Are Prices Falling in Algonquin?
Algonquin's price decline comes down to supply growing faster than demand can keep up. Active listings jumped 11.1%, and new listings rose 12.4%, putting more options in front of buyers. Pending sales did increase 12.2%, but with 2.9 months of supply — the highest in this part of the metro — sellers face more competition for buyer attention. Homes spend a median of 55 days on market, longer than most nearby areas. The elevated rate of price cuts suggests sellers are learning they can't hold out for last year's prices, and buyers may find more room to negotiate than in tighter markets nearby.
| Neighborhood | Median Price | Price YoY | Price Drops | Months of Supply |
|---|---|---|---|---|
| Algonquin ★ | $414,716 | -3.3% | 24.6% | 2.9 |
| West Algonquin | $424,785 | -12.4% | 26.2% | 3.4 |
| East Algonquin | $379,817 | +4.1% | 20.2% | 2.1 |
| Far West Algonquin | $554,732 | +2.7% | 25.7% | 2.5 |
| High Hill Farms | $399,807 | -21.4% | 45.7% | 1.8 |
Limited to neighborhoods with at least 10 home sales in the period.
All data comes from Redfin and represents a three-month rolling average ending August 2026. This article has been generated, in whole or in part, using generative artificial intelligence (AI) technology, with input from Redfin head of economics research Chen Zhao. While efforts have been made to ensure the accuracy and reliability of this information, you should independently verify all data, facts, and citations contained in this article before relying on it for any purpose. This information is not a substitute for advice from a real estate agent, financial advisor, or other licensed professional. Check the Redfin Data Center for additional in-depth housing market data.
Categories
Recent Posts





Redfin Principal Agent License ID: IL #475159373
+1(773) 206-5927 | jenny.habetler@redfin.com